



case 0028
quick service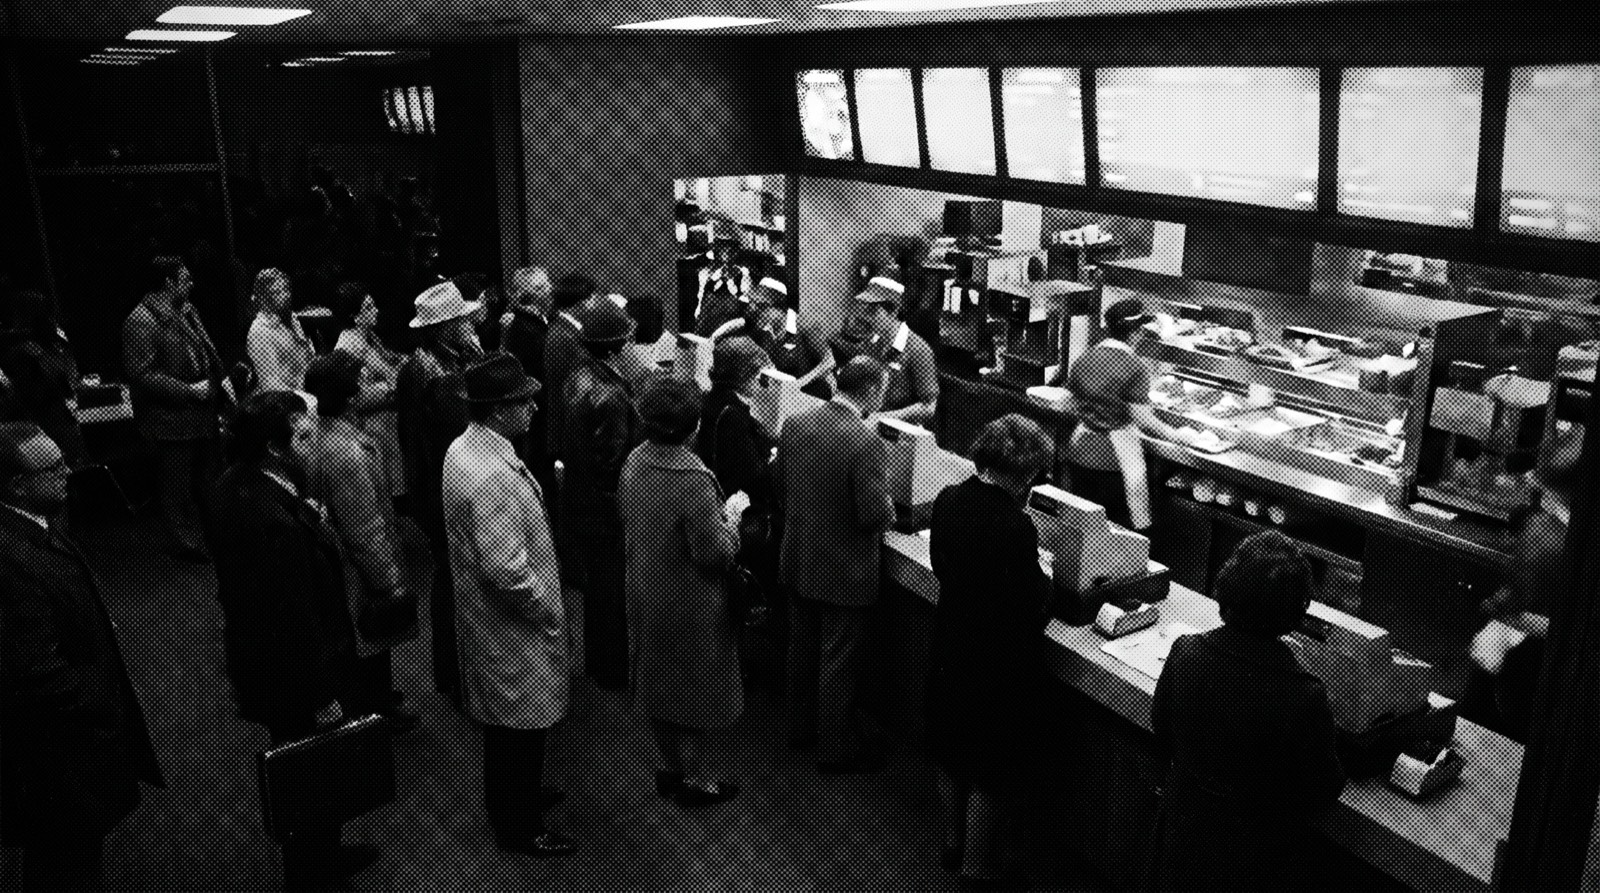
Price change
A quick service chain prices a $1 combo increase across 6 markets and rolls it out only where traffic holds.
4 of 6 markets hold
A wall-sized reality map: gray branch futures fan out across five checkpoints, and one orange path, the base reality, threads through them to the future you want. A simulation clock ticks in the corner.
Studio builds a living society of your market and plays every version of your decision through it, so you commit to the one your customers reward.
95%
forecast accuracy5
enterprise clients200M
consumers modeled300+
cohorts per society30+
weeks per runTest every version of your launch: a price, a placement, a promotion. Watch the outcome each version creates, and commit to the one you want. Scroll to review 3 of them.
A wall of 12 monitors, each showing the same supermarket product launch in a parallel world, each world testing one different choice: prices, placements, promotions. The view dives into world 0047, where the 9.49 price fails: adoption 11 percent, trust 26 percent, repeat 7 percent. It glides to world 0311, the wide campaign: 44, 41, and 29 percent. It locks onto world 0214, sampling seeded with regulars: adoption 95 percent, trust 88 percent, repeat 61 percent, framed in orange: the version you green-light.
Studio reads the record your market already leaves, public chatter, reviews, and press, alongside your own data: sales, loyalty, app events, and demographics. Everything lands as evidence about groups, never about a person.
An ingestion diagram with 8 sources in two clusters. Public record: reddit, tiktok, reviews, and census and public statistics. Your own data: point of sale and card spend, loyalty and rewards, CRM records, and app and site events. Each streams continuously along a curved wire into its own port on the society model: a live segmentation panel naming the cohorts Studio builds, regulars 31%, deal-triggered 24%, switchers 19%, adopters 14%, and skeptics 12%, across a population of 200 million. The receiving cohort lights as each signal lands, and its evidence row lights beside it. Signals describe groups, never a person.
A whole market is too big to predict and one customer is too noisy. Studio models the groups in between, and the influence running between them, because groups behave in patterns you can trust.
Buy on habit. Moved by availability and routine, not ads.
31%
78%
low
Influences: deal-triggered, vocal skeptics. The dotted lines on the model show where this group moves first.
Not for one coupon. Move my usual brand off the shelf and we have a problem.
Cohorts are named for how they decide, never for who they are. The model holds hundreds more; these 5 carry most of a launch. Click any cluster to inspect a group.
A streaming service weighs a theatrical opening for its next release. Studio plays 30 weeks of it, one version of the decision at a time, and returns the KPIs you already run: adoption, trust, repeat, revenue lift.
A 30-week simulation scrubs from week 2 to week 30, shown as the seat map of a 264-seat auditorium filling in week by week. At week 2 only 24 seats are taken and adoption reads 9 percent in red. By week 14 the middle rows are filling. By week 27 the house is nearly sold out at 240 of 264 seats: adoption 91 percent, trust 84 percent, in green.
Insight and marketing teams point it at decisions like these. The board keeps moving; hover to hold it.
A quick service chain prices a $1 combo increase across 6 markets and rolls it out only where traffic holds.
4 of 6 markets hold
A streaming service tests 5 cancellation flows and finds the pause offer keeps 3 times more subscribers.
best save of 5 flows tested
A snack brand runs spring against fall for the same launch and learns the shelf matters more than the buzz.
fall wins 8 extra weeks of shelf
A national newsroom tests 3 framings of the same story and learns which one readers trust, and how to say it.
1 of 3 framings earns trust
A retail bank introduces a monthly account fee 3 ways and finds the one customers accept without leaving.
churn holds under 2%
A stadium prices season tickets 4 ways and finds the one that fills the upper bowl without hurting renewals.
renewals hold across 4 tiers
A coffee chain retires 2 slow items and tests 3 replacements before a single store changes its menu.
2 of 3 replacements earn a slot
A retailer tries its new line in 4 in-store placements and learns where discovery actually happens.
entrance beats end cap 2 to 1
Three choices in how the engine works. Open any of them for the longer story.
Three small instruments. First: the same chart twice, one person's jagged week-by-week line that says nothing beside 12 faint member lines resolving into one bold cohort pattern. Second: a static questionnaire form stands beside a grid of 56 people who fill in one by one as they buy, a live counter climbing to 50 of 56, actions instead of answers. Third: the same run draws the same curve twice, a sweep verifies it point by point, and a readout confirms the runs match.
Ask what one person does next and you get noise. How a group moves, and who it moves with, is something you can trust.
Nobody gets a questionnaire. Studio runs the launch inside the society and measures behavior: buying, returning, leaving.
The same decision in the same society returns the same result. Repeatable, auditable, defensible next quarter.
A 30-minute walkthrough with the founding team.